The odds of dying in a car crash might surprise you. The encouraging news is there is a steady decrease in traffic deaths, thanks in part to better traffic safety practices by states.
Statistics and Odds of Dying in a Car Crash
The current statistics for deaths due to car crashes have a couple of years' lag time. However, you can see specific patterns emerging over the last few years of the odds of dying if you're in a car crash. The National Safety Council of America states that the odds of dying in a motor vehicle crash are 1 in 114. The lifetime chances of dying in a car crash are 1 in 608.
Chances of Dying in a Car Crash
As with any mathematical odds, you must consider your location, how often you drive, your occupation, and the average distance you drive to work for the chances of dying in a car crash. All of these factors can play an important role in your odds of being in a car crash as well as your odds of dying in one.
2019 Motor Vehicle Fatalities Lowest in Third Consecutive Years
The NHTSA (National Highway Traffic Safety Administration) estimates the statistics for 2019 reported so far show a reduction in vehicle fatalities for the third year in a row. Highway crashes are still on the decline for traffic deaths. The NHTSA reports a decrease of 3% for driver deaths and 4% of passenger deaths.
Road to Zero
The National Safety Councils credits the various risk mitigation actions that many states have implemented over the past few years. So far, 10 cities have initiated change set out by the National Safety Council's Road to Zero Program. The program's goal sets 2050 as the year to realize their goal of an end to roadway deaths in the US. Road to Zero aims to make streets safer via the redesign of known high-crash areas and lowering the legal limit for alcohol concentration.
The 2018 Fatal Crash Statistic List by State
The latest available fatal crash statistics are for 2018. These show a decrease in vehicle fatalities from 2017. In 2018, the United States vehicle crash fatalities were 33,654. This equates to 11.2 deaths per 100,000 people.

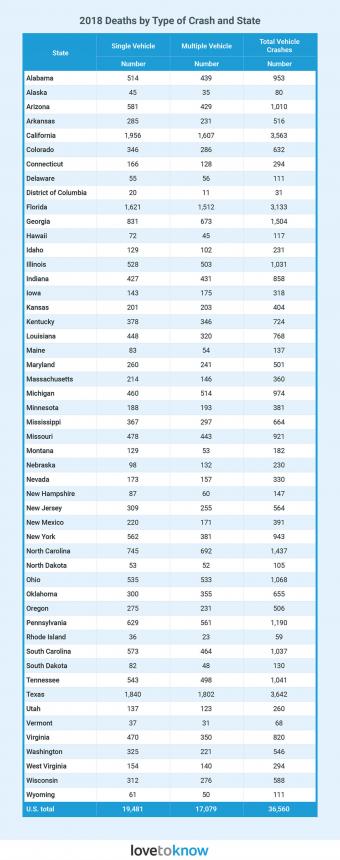
2018 Deaths by Type of Crash and State
The type of vehicle is tracked as whether it's a single vehicle or multiple vehicles involved in the vehicle crashes. In 2018, 53% of deaths by vehicle crash in the US were single vehicle crashes.
2018 Vehicle Fatalities by Type of Vehicle
The deaths caused by motor vehicle crashes fluctuate from one state to another. Some states have a higher death rate for pickups, while other states have a higher death rate for cars. Much of this depends on the economics of a state, such as an agricultural state will have more pickups and SUVs than a state with many large cities where cars are more prevalent for transportation.

Statistics for Teenage Deaths by Car Crash
The CDC reported in 2017 that 2,364 American teens between the ages of 16 and 19 died in car accidents. 300,000 teens were injured and treated in emergency rooms. This averaged to six teens dying each day in a car crash. This age group is three time more likely to die in a car crash than people 20 years old and older.
US Three-Year Decline in Motor Vehicle Deaths
The National Highway Traffic Safety Administration reported in 2018 there was a 6% drop in speeding-related motor vehicles deaths despite an increase of people driving more. The death rate of children 14 and younger decreased by 10%. The US Department of Transportation reports that in 2019, deaths from motor vehicle crashes was down 1.2% from 2018. This marked the third year of decreases in motor vehicle deaths despite a 0.9% increase in miles driven for 2019.
CDC Statistics of Car Crash Deaths Worldwide
According to the CDC (Centers of Disease Control and Prevention), 1.35 million people are killed worldwide in vehicle accidents. The Association for Safe International Road Travel reports that around the world, 3,700 people a day lose their lives in a traffic accident. Of those deaths, over 50% are pedestrians, cyclists, and motorcyclists. This makes death by traffic crashes the eighth leading cause of death worldwide. According to the WHO (World Health Organization), 22 countries have changed laws to implement best practices in an effort to reduce road related fatalities.
Income Bracket Deaths by Car Crashes
The largest number of deaths worldwide are of people in the low to middle income brackets. This is roughly 90% of the traffic-related deaths. Ironically, only 60% of the world's vehicles are owned by the population in this income bracket.
Other worldwide statistics include:
- Traffic deaths are the number 1 cause of death in children ages 5 to 14.
- Traffic deaths are the number 1 cause of death in young adults ages 15 to 29.
- Every 24 seconds 1 person dies in a traffic crash/accident.
Odds of Dying From a Vehicle Crash Slowly Getting Better
Your odds of dying in a car crash are on the decline. By using the various statistics, you can begin to see a pattern based on the reporting by states.